Consumption history
On the Usage History tab, you can easily monitor your API project’s consumption. An overview is available both monthly and daily.
Monthly Usage History
In the table on the Usage History tab, you can clearly see the individual months of API usage. The first row always represents the current month, which has not yet concluded. For each month, you can also see:
- Total credits consumed
- Number of free credits used
- Number of paid credits used
- Total amount paid
Daily Usage History
Click the Usage Details button to display daily usage within the selected month. You will clearly see the number of calls for each API function per day.
Below the table, you will find:
- Total calls for the entire month
- Total credits used by each function
Each API call costs a certain number of credits. You can find the specific cost per call in our price list.
By default, consumption is shown for the entire project, but you can easily switch to viewing individual API keys. Please note: For billing purposes, consumption is always summed across all the project’s API keys.
Daily Usage Chart
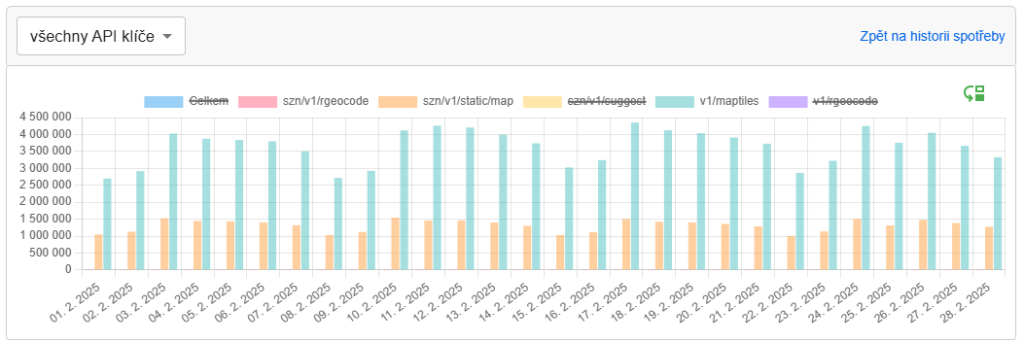
For even greater clarity, you have access to a daily usage chart. You can freely toggle individual API functions on or off by clicking items in the legend.
Monitor your project’s usage more effectively and keep your costs always under control!