Interactive daily API consumption graph
17. 3. 2025
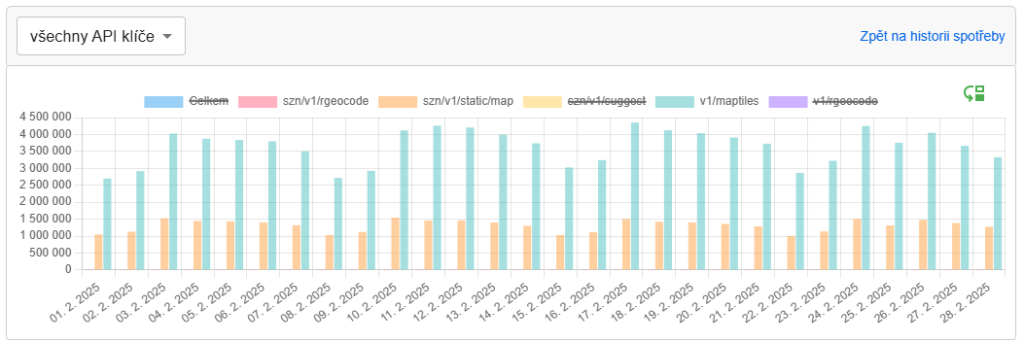
We’ve just added a new interactive chart to the daily usage history! It instantly shows how the usage of individual API functions evolves over the course of the month. This makes it easy to detect not only typical trends but also unexpected changes in consumption.
For more information, visit the Usage History page.